Balancing an ELK on top of a Raspberry, part one
Adding Intrusion Detection to OpenWRT with Raspberry Pi and ELK
The goal of this projects is to install intrusion detection monitoring and alerting on a home lab network. The following components will be installed and configured:
- Set up and configure Raspbian on Raspberry Pi
- Install and configure Suricata for Intrusion Detection
- Utilize Elastic, Logstash and Kibana for monitoring and log management
Let’s Begin!
The archiecture
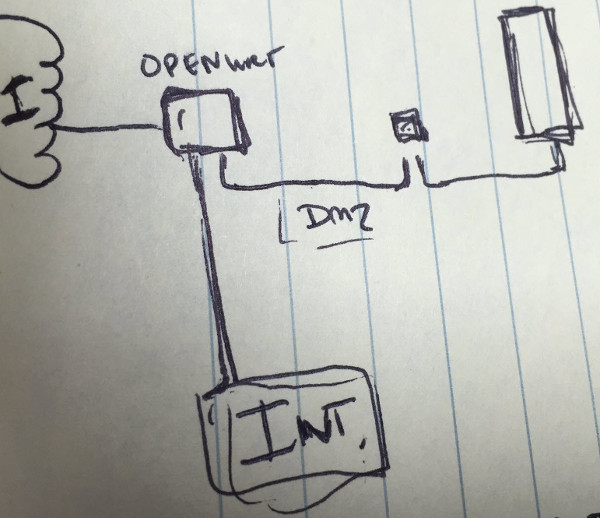
The purpose of this project will be to set up an intrusion detection system to monitor home traffic, and specifically traffic moving between the 3 zones previously configured in the router: internal, DMZ and external. The primary goal will to watch out for anomalies, and specfic traffic patterns we would not like to see.
I wanted to set up intrusion detection in a low cost way, but I didn’t want to do any extra processing on the OpenWRT router itself. That’s what has made using Raspberry Pi a really great solution. It’s small, lightweight, versatile, low-power etc.
Ideally, I would have set up the Raspberry Pi inline between the external and other networks. This would have allowed for true intrusion prevention capabilities. To do this with a Raspberry, extra work would have been required because it only has one ethernet interface. Either a second USB NIC adapter would have been needed, or sub-intefaces and vlan’s would have been the solution. Out of those two, I like the second better, but I don’t have an extra managed switch at the moment, and quite frankly I was too lazy to do all this now. I will come back to later. For the moment, setting up the detection will be the goal.
Setting up Raspberry Pi
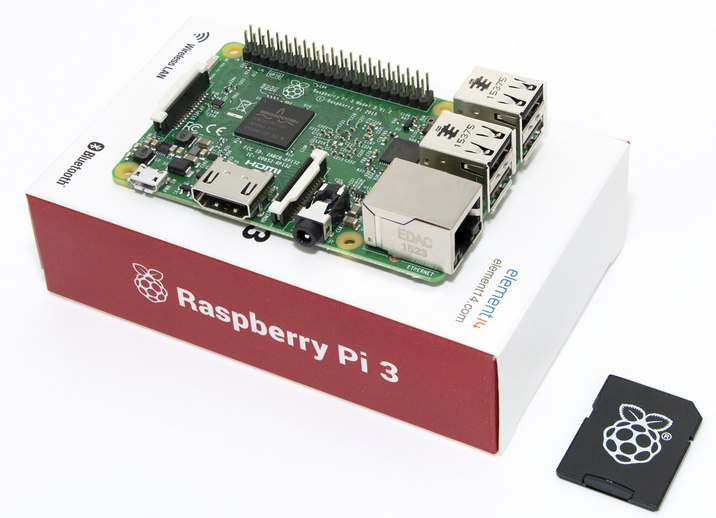
This was really a non-event. The Raspberry Pi device was extremely easy to set up and use. The Raspberry Pi website has a ton of information on getting started with these cool little machines. Check it out at https://www.raspberrypi.org/. The device was hardened somewhat similar as described in previous posts, and also sendmail was installed for email.
Installing Suricata
This was really easy too!
apt-get install suricata
So… that’s it. Just worked. I also renamed the default config file, as follows.
mv /etc/suricata/suricata-debian.yaml /etc/suricata/suricata.yaml
Finally, I edited it to define the “host-os” and “$HOME_NET” and $EXTERNAL_NET” networks as applicable to the lab environment. That is pretty much it for that too. A tail of /var/log/suricata/fast.log will show a variety of items coming through.
Checksum errors
In my environment, I was getting a ton of checksum errors that were really clogging up the log. For the purposes of testing with a relatively unclutterd logs, I decided to disable these events. This was done by setting the value of “checksum-validation” to “no” in the /etc/suricata/suricata.yaml file. This didn’t stop all of them, so I also commented out some of the individual events in the /etc/suricata/rules/decoder-events.rules. To test the functionality of Suricata, I created a custom rule, and then sent specfic traffic to set it off. This will be demonstrated as part of the Logstash configuration.
Setting up the ELK pieces
To set up Logstash, Elasticsearch and Kibana, I largely followed the tutorial that was published by a security professional named Travis Smith who figured out the specific challenges to getting these applications to run on the Raspberry Pi architecture. He published his work on his blog at on his blog. The tutorial is excellent and also includes the details needed to complete the install. I will includes the pieces that are most relevant or where I veered away from the instructions. For example, Travis Smith use Bro IDS, but I decided to go with Suricata.
Installing Elasticsearch
This was super easy. No real need to do anything special to accomodate the ARM. The following is from the Sweet Security set up file:
sudo wget https://download.elastic.co/elasticsearch/elasticsearch/elasticsearch-2.3.2.deb
sudo dpkg -i elasticsearch-2.3.2.deb
sudo rm elasticsearch-2.3.2.deb
sudo update-rc.d elasticsearch defaults
Replace the .deb file with the updated version from the elastic.co website.
Install Logstash
A little more complicated, this is definitely where I appreciated Travis Smith’s work.
sudo wget https://download.elastic.co/logstash/logstash/packages/debian/logstash_2.3.2-1_all.deb
sudo dpkg -i logstash_2.3.2-1_all.deb
sudo rm logstash_2.3.2-1_all.deb
cd /home/pi
sudo git clone https://github.com/jnr/jffi.git
cd jffi
sudo ant jar
sudo cp build/jni/libjffi-1.2.so /opt/logstash/vendor/jruby/lib/jni/arm-Linux
cd /opt/logstash/vendor/jruby/lib
sudo zip -g jruby-complete-1.7.11.jar jni/arm-Linux/libjffi-1.2.so
cd /home/pi
sudo rm -rf jffi/
sudo update-rc.d logstash defaults
sudo /opt/logstash/bin/plugin install logstash-filter-translate
sudo mkdir /etc/logstash/translate
I didn’t end up using the Logstash translate piece, or the Sweet Security custom scripts.
sudo wget https://download.elastic.co/kibana/kibana/kibana-4.5.0-linux-x86.tar.gz
sudo tar -xzf kibana-4.5.0-linux-x86.tar.gz
sudo mv kibana-4.5.0-linux-x86/ /opt/kibana/
sudo apt-get -y remove nodejs-legacy nodejs nodered		#Remove nodejs on Pi3
sudo wget http://node-arm.herokuapp.com/node_latest_armhf.deb
sudo dpkg -i node_latest_armhf.deb
sudo mv /opt/kibana/node/bin/node /opt/kibana/node/bin/node.orig
sudo mv /opt/kibana/node/bin/npm /opt/kibana/node/bin/npm.orig
sudo ln -s /usr/local/bin/node /opt/kibana/node/bin/node
sudo ln -s /usr/local/bin/npm /opt/kibana/node/bin/npm
sudo rm node_latest_armhf.deb
Then setup the INIT.D file…
sudo cp SweetSecurity/init.d/kibana /etc/init.d
sudo chmod 755 /etc/init.d/kibana
sudo update-rc.d kibana defaults
Configuring Logstash to work with Suricata
To input data detected by Suricata into Logstash, it is necessary to configure /etc/logstash/conf.d/logstash.conf as follows:
input {
  file {
    path => ["/var/log/suricata/eve.json"]
    #sincedb_path => ["/var/lib/logstash/"]
    start_position => beginning
    codec =>   json
    type => "SuricataIDPS"
  }
Logstash is cool because once the input is configured you can set up specific filters and actions. For example, one thing I was interested in is seeing SSH traffic in my internal network and then getting an email letting me know it is occurring. To set up specific actions you like that, you would do something the following. The alert is based on a custom Suricata rule set up to monitor SSH traffic flows:
if [alert][signature_id] == 999999  {
    email {
      from => "root"
      subject => "Alert::  SSH connection attempt detected"
      to => "youremail@domain.com"
      via => "sendmail"
      body => "Suricata detected the following event: %{[alert][signature]}.<p>  The event was detected at %{[timestamp]}"
      htmlbody => "<div align='left'><h2>SSH Connection alert detected from Suricata</h2></div><div 	align='left'><h3>Full Event</h3><u>Signature:</u> %{[alert][signature]}<br/><u>Detected at:</u> %{[timestamp]}<br/><u>Detected from:</u> %{[src_ip]}<br/><u>Target:</u> %{[dest_ip]}</div>"
      # options => { "location" => "/run/sendmail" }
    }
  }
As you can see, Sendmail is being used for the emails, and relaying again through Google’s mail service. The setup was similar to what has been done in previous posts and was really easy. This post walks through the instructions very clearly.
Once all that is done, the only other thing that is needed is to set up Suricata to run at startup. This is done quite simply by editing /etc/default/suricata and change set run to “yes” and fix the path to the yaml file. Unless you’re using Suricata inline and are configuring NFQUEUE, set that to PCAP as well.
Once that’s done, that really should be it for basic set up. The only other things I notice was a minor issue with an unqualified hostname/sleeping for retry errors in Sendmail based on the way the lab hosts file was set up. This was pretty easy fixes.
Some other cool websites on Logstash:
http://dopey.io/logstash-filter-alert.html
https://github.com/SMAPPER/Logstash-Configs/blob/master/suricata.conf
https://www.elastic.co/guide/en/logstash/current/config-examples.html
http://tales.itnobody.com/2013/07/using-logstash-to-log-smtp-bounces-like-a-boss.html
Conclusion
The Raspberry Pi is a damn cool computing device! Set up like a dream, so no real issues in this post. Next time, we’ll focus pushing traffic from OpenWRT and performing some basic analysis.